SCIENCE NOTEBOOK
Large Natural Slope Failures in the Greater Himalaya and the Rest of the World, 1988–2026
Revised after the GLOF-trigger audit. This is a working research notebook, not a polished paper. It deliberately records inclusion/exclusion choices, corrections, uncertainties, unresolved events, and the numerical steps used in the statistics.
1. Research question and population definition
- Question: Are large natural high-mountain slope failures becoming more frequent and/or larger, and does the Greater Himalayan temporal pattern differ from the rest of the world?
- Period: 1988–2026 inclusive = 39 calendar years.
- Thresholds: >1 million m³ and >10 million m³. The >1 catalogue is much more vulnerable to historical under-detection.
- Revised process definition: natural gravitational slope failures involving rock, glacier ice, frozen moraine, permafrost-rich debris, or mixtures of these materials. A GLOF-triggering failure can qualify if the initiating slope failure itself crosses the threshold.
- Volume rule: use initial/source failure volume. Do not substitute lake water volume, GLOF discharge, downstream erosion, entrained debris, deposit volume, or total cascade volume.
- Natural failures only. Anthropogenic mine failures are excluded. Volcanic-edifice failures are excluded as a distinct process population.
- Isolated earthquake-triggered failures remain in the main series. A secondary sensitivity test removes clearly earthquake-triggered events.
- The 2008 Wenchuan earthquake landslide swarm is excluded entirely, including Daguangbao, because it is an exceptional correlated swarm that would dominate a temporal catalogue.
- Greater Himalaya = Himalaya + Karakoram + eastern Himalayan syntaxis around Yigong/Sedongpu. It is not all of High Mountain Asia. Nyainqêntanglha events such as Ranzerio and Jinwuco are assigned to Rest of World under this working geographic split.
- Lirung 2026: >10 Mm³ classification is treated as secure for frequency work; 100 Mm³ remains a provisional plotting value.
2. Why the GLOF audit changed the catalogue
The original search emphasized rock/ice-avalanche inventories. That creates a classification blind spot: an initiating slope collapse may be filed in the literature primarily as a GLOF. We therefore audited known Himalayan/Tibetan GLOFs for a qualifying initiating mass movement. A large GLOF is not automatically a large slope failure; only the initiating mass volume is used.
| Event | Initiating process / volume | Geography | Decision | Reason |
| South Lhonak, 2023 | ~14.7 Mm³ frozen moraine/permafrost collapse | Greater Himalaya | INCLUDE >1 and >10 | Detailed reconstruction; do not use ~50 Mm³ lake water or ~270 Mm³ downstream sediment. |
| Langmale/Upper Barun, 2017 | ~1.1 Mm³ avalanche mass entering lake; source rockfall also described as >1 Mm³ | Greater Himalaya | INCLUDE >1 PROVISIONAL | Mass value is reconstruction/model-based; not >10. |
| Ranzerio/Recireco, 2013 | ~3.8 Mm³ glacier-tongue collapse | Nyainqêntanglha | INCLUDE Rest-world >1 | Outside working Greater-Himalaya boundary. |
| Jinwuco, 2020 | ~1.2 Mm³ lateral-moraine landslide | Nyainqêntanglha | INCLUDE Rest-world >1 | DEM differencing; uncertainty a few 10^5 m³. |
| Poiqu No. 1, 2002 | Ice avalanche trigger; source volume unresolved | Greater Himalaya | UNRESOLVED | Do not infer avalanche volume from lake loss or discharge. |
| Tam Pokhari, 1998 | Ice-avalanche/overhanging-glacier involvement; source volume unresolved | Greater Himalaya | UNRESOLVED | Published ~19.5 Mm³ refers to released water, not avalanche volume. |
| Chubung, 1991 | Ice avalanche trigger probable; source volume unresolved | Greater Himalaya | UNRESOLVED | Hold until source-volume estimate is found. |
| Gongbatongsha, 2016 | ~0.003–0.006 Mm³ debris entering lake | HMA | EXCLUDE | Far below 1 Mm³. |
| Birendra Lake, 2024 | ~0.2 Mm³ ice/snow avalanche | Greater Himalaya | EXCLUDE | Below threshold. |
| Thame, 2024 | No convincing >1 Mm³ slope trigger in latest reconstruction | Greater Himalaya | EXCLUDE | Outburst mechanism not a qualifying large slope failure. |
| Gya, Ladakh, 2014 | Moraine piping/breach | Greater Himalaya | EXCLUDE | No qualifying initiating slope collapse. |
| Luggye Tsho, Bhutan, 1994 | Large GLOF, but no quantified >1 Mm³ initiating slope failure | Greater Himalaya | EXCLUDE / HOLD | Large water release alone cannot qualify. |
3. Greater Himalayan working catalogue after audit
| Year | Event | Source vol. Mm³ | Class | Notebook note |
| 1988 | Darbang, Nepal | 5.0 | >1 | 109 deaths; independent addition |
| 1991 | Sulmanabad | 8.0 | >1 | working estimate |
| 1991 | “102 Landslide”, SE Tibet | 5.1 | >1 | source estimate |
| 1992 | Lokpar/Aling | 20.0 | >10 | |
| 1992 | Chillinji | 2.5 | >1 | 2–3 range; midpoint for plotting |
| 1998 | Tatopani | 1.1 | >1 | just above strict threshold |
| 2000 | Yigong | 91.0 | >10 | use source ~91, not entrained/final ~300 |
| 2000 | North Terong | 7.6 | >1 | |
| 2005 | Hattian Bala | 68.0 | >10 | earthquake-triggered; retained in main series |
| 2009 | Miyar | 1.87 | >1 | |
| 2010 | Attabad | 45.0 | >10 | working source estimate; alternative ~25 exists |
| 2010 | Siachen | 109.0 | >10 | |
| 2012 | Gayari | 3.8 | >1 | |
| 2012 | Seti | 12.5 | >10 | 10–15 range; midpoint for plotting |
| 2014 | Jure | 6.0 | >1 | working source; larger values may refer to deposit/slide |
| 2015 | Langtang | 8.0 | >1 | earthquake-triggered |
| 2017 | Sedongpu/Gyala Peri | 50.0 | >10 | ~17+33 source areas treated as one event |
| 2017 | Langmale/Upper Barun | 1.1 | >1 provisional | rockfall/rock-ice avalanche; ~1.1 Mm³ entering lake used in reconstruction |
| 2018 | Sedongpu rock/ice avalanche | 9.0 | >1 | separate event |
| 2018 | Sedongpu glacier detachments | 130.0 | >10 | two detachments, aggregate 130; one scatter point but TWO frequency events |
| 2020 | Zelongnong | 1.14 | >1 | borderline process class; retained |
| 2021 | Chamoli | 27.0 | >10 | |
| 2021 | Sedongpu | 50.0 | >10 | 22 Mar |
| 2021 | Upper Naltar | 14.0 | >10 | |
| 2023 | South Lhonak, Sikkim | 14.7 | >10 | frozen lateral-moraine/permafrost collapse into lake; use source collapse, not GLOF water |
| 2026 | Lirung | 100.0 | >10 | 100 provisional plotting value; >10 classification treated as secure |
Frequency-count convention: the two 2018 Sedongpu glacier detachments are two failures for event-frequency statistics even though their published ~130 Mm³ volume is aggregate and therefore appears as one point in a source-volume scatter plot.
Borderline/held items: Malpa 1998 is ~1 Mm³ and excluded by strict >1; Choya Deurali 2018 (~2.5 Mm³) still requires source verification; Poiqu No.1 2002, Tam Pokhari 1998, and Chubung 1991 remain unresolved because the initiating avalanche volume has not been quantified adequately.
4. Rest-of-world working plotting catalogue after audit
| Year | Event | Source vol. Mm³ | Class | Notebook note |
| 1991 | Randa, Switzerland | 22.5 | >10 | ~30 total in phases; count as one episode |
| 1991 | Aoraki/Mt Cook, NZ | 11.8 | >10 | ±2.4 |
| 1991 | Touzhai, China | 15.0 | >10 | discrepancy ~9 vs ~15; frozen >10 uses ~15 |
| 1992 | Mt Fletcher 1, NZ | 7.8 | >1 | |
| 1992 | Mt Fletcher 2, NZ | 5.0 | >1 | |
| 1992 | Kshwan, Canada | 3.2 | >1 | |
| 1997 | Mount Munday, Canada | 3.2 | >1 | |
| 1997 | Brenva, Alps | 2.0 | >1 | |
| 1999 | Tsaoling, Taiwan | 125.0 | >10 | Chi-Chi earthquake |
| 1999 | Jiufengershan, Taiwan | 42.0 | >10 | Chi-Chi earthquake |
| 1999 | Mt Adams, NZ | 12.5 | >10 | 10–15 midpoint |
| 2000 | Tsar Mountain, Canada | 1.6 | >1 | |
| 2002 | Kolka–Karmadon | 12.0 | >10 | working >10 classification |
| 2002 | McGinnis Peak N, Alaska | 18.4 | >10 | Denali earthquake cluster |
| 2002 | McGinnis Peak S, Alaska | 11.4 | >10 | Denali earthquake cluster |
| 2005 | Mount Steller, Alaska | 40.0 | >10 | initial/source estimate varies |
| 2006 | Guinsaugon, Philippines | 12.5 | >10 | 10–15 midpoint |
| 2007 | Punta Cola, Chile | 20.9 | >10 | earthquake-triggered |
| 2007 | Mount Steele, Canada | 54.0 | >10 | 27.5–80.5 range; central plotting value |
| 2007 | Morsárjökull | 4.0 | >1 | working broad catalogue |
| 2008 | Mount Miller, Alaska | 22.0 | >10 | |
| 2009 | Xiaolin, Taiwan | 27.6 | >10 | typhoon |
| 2012 | Lituya Mountain, Alaska | 20.0 | >10 | >20 working |
| 2013 | Mount Dixon | 1.75 | >1 | |
| 2013 | Ranzerio/Recireco, SE Tibet | 3.8 | >1 | glacier-tongue collapse; outside Greater Himalaya |
| 2015 | Taan Fiord, Alaska | 76.0 | >10 | |
| 2016 | Aru 1 | 68.0 | >10 | not Himalaya |
| 2016 | Aru 2 | 83.0 | >10 | not Himalaya |
| 2016 | Lamplugh, Alaska | 51.7 | >10 | |
| 2016 | Hapuku, NZ | 20.0 | >10 | earthquake-triggered |
| 2017 | Karrat Fjord, Greenland | 39.0 | >10 | ~38–40 |
| 2017 | Piz Cengalo/Bondo | 3.27 | >1 | |
| 2017 | Xinmo | 7.7 | >1 | working broad catalogue |
| 2018 | Fagraskógarfjall, Iceland | 7.0 | >1 | |
| 2018 | Bureya, Russian Far East | 24.5 | >10 | |
| 2020 | Elliot Creek, Canada | 18.6 | >10 | |
| 2020 | Jinwuco, Tibet | 1.2 | >1 | lateral-moraine landslide; outside Greater Himalaya |
| 2023 | Peters Dome, Alaska | 6.1 | >1 | |
| 2023 | Dickson Fjord, Greenland | 25.0 | >10 | |
| 2024 | Piz Scerscen, Alps | 8.5 | >1 | 8–9 midpoint |
| 2025 | Blatten/Birch Glacier, Switzerland | 9.4 | >1 | ~9.3–9.5; below >10 |
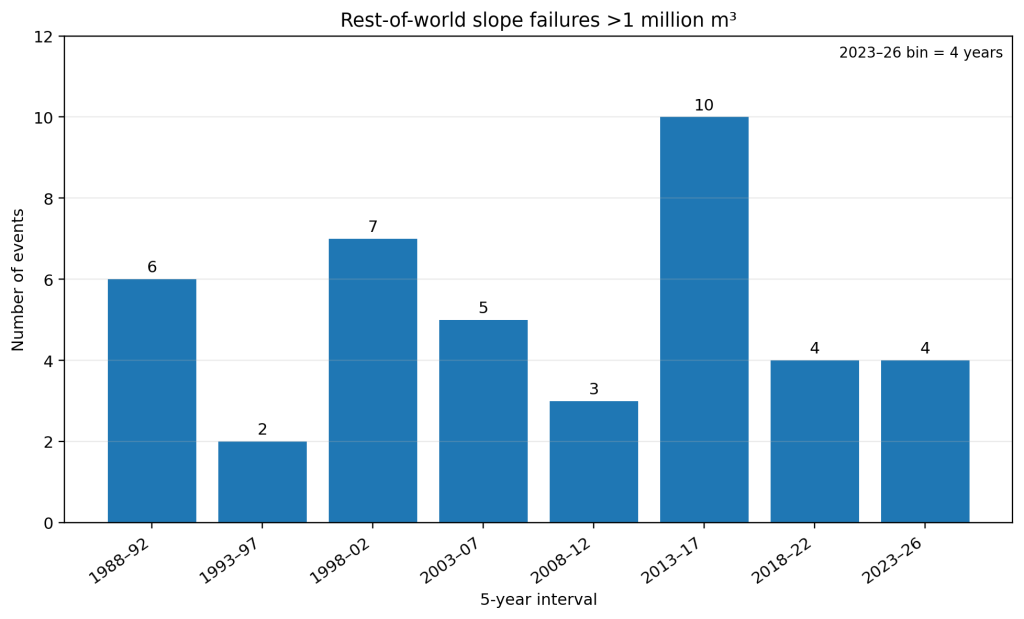
The rest-of-world >1 plotting set is now 41 observations because Ranzerio 2013 (~3.8 Mm³) and Jinwuco 2020 (~1.2 Mm³) were added after the GLOF audit. The >10 rest-of-world set remains 25.
Historical incompleteness remains important. Earlier events discussed but not restored to this compact 41-row plotting table include Tetsa 1988 (~2), Frobisher I 1990 (~3.1), Frobisher II 1991 (~2.4), Turnoff Creek 1992 (~4), Zuetribistock 1996 (~1.1), and Howson II 1999 (~1.5). Their discovery demonstrates that the >1 record is not complete enough for a strong physical trend claim.
5. Revised histogram arithmetic
| Interval | H >1 | H >10 | Rest >1 | Rest >10 | World >1* | World >10 |
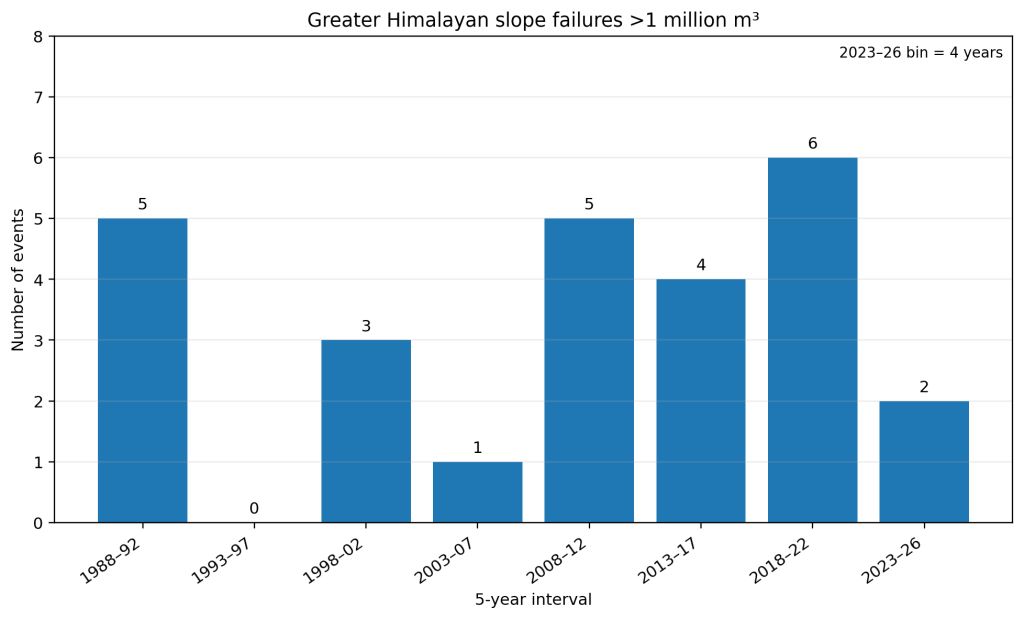
| 1988–1992 | 5 | 1 | 6 | 3 | 11 | 4 |
| 1993–1997 | 0 | 0 | 2 | 0 | 2 | 0 |
| 1998–2002 | 3 | 1 | 7 | 6 | 10 | 7 |
| 2003–2007 | 1 | 1 | 5 | 4 | 6 | 5 |
| 2008–2012 | 5 | 3 | 3 | 3 | 8 | 6 |
| 2013–2017 | 4 | 1 | 10 | 6 | 14 | 7 |
| 2018–2022 | 6 | 5 | 4 | 2 | 10 | 7 |
| 2023–2026 | 2 | 2 | 4 | 1 | 6 | 3 |
Greater Himalaya >1: 5 + 0 + 3 + 1 + 5 + 4 + 6 + 2 = 26.
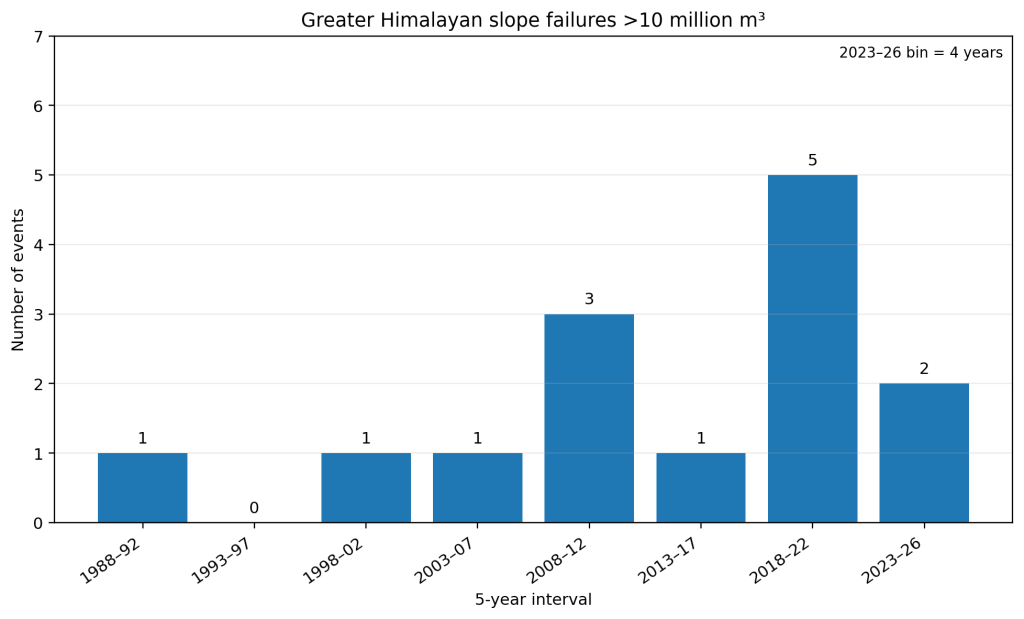
Greater Himalaya >10: 1 + 0 + 1 + 1 + 3 + 1 + 5 + 2 = 14.
Rest of world >1: 6 + 2 + 7 + 5 + 3 + 10 + 4 + 4 = 41.
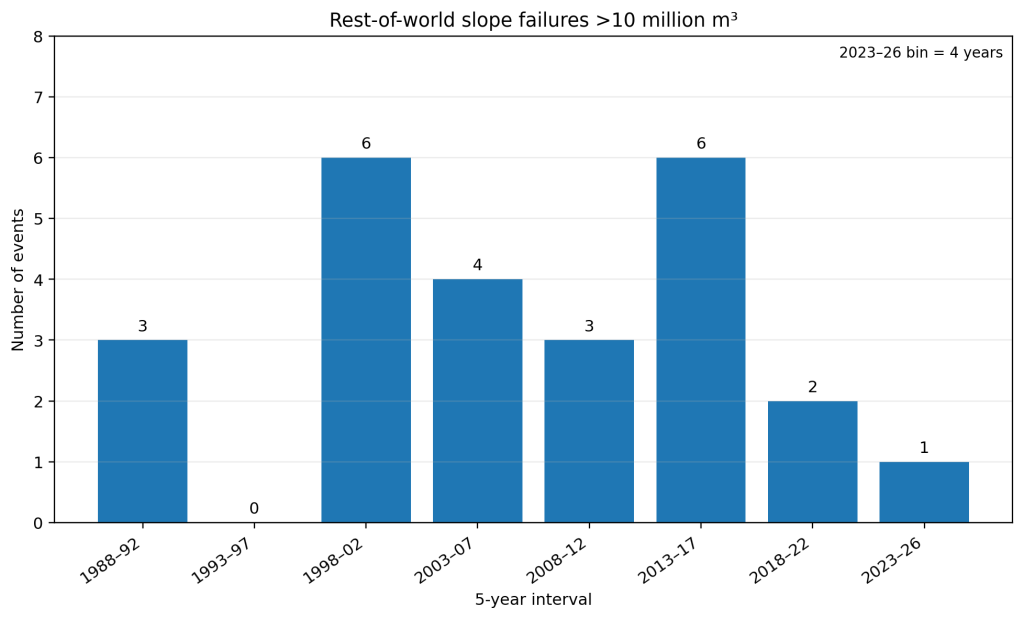
Rest of world >10: 3 + 0 + 6 + 4 + 3 + 6 + 2 + 1 = 25.
Worldwide >10: 4 + 0 + 7 + 5 + 6 + 7 + 7 + 3 = 39.
*The ‘World >1’ column is only the sum of the two compact plotting lists, not a claim of a comprehensive global >1 inventory. The final 2023–26 interval contains only 4 years.
6. What changed relative to the earlier graphs
- Greater Himalaya >1: 24 → 26 observations; 2013–17 bin 3 → 4 because Langmale is added provisionally; 2023–26 bin 1 → 2 because South Lhonak is added.
- Greater Himalaya >10: 13 → 14 events; 2023–26 bin 1 → 2 because South Lhonak is added.
- Rest-of-world >1: 39 → 41 observations; 2013–17 bin 9 → 10 because Ranzerio is added; 2018–22 bin 3 → 4 because Jinwuco is added.
- Rest-of-world >10 remains 25 events, with bins 3,0,6,4,3,6,2,1.
- Therefore the previously produced >1 graphs and the Himalayan >10 graph are superseded by the revised catalogue. The old image-generator infographic remains invalid and must never be used.
7. Statistical notebook: exact setup and hand-worked calculations
7.1 Poisson model
For each year i, yᵢ is the number of events and tᵢ = year−1988. Assume yᵢ ~ Poisson(λᵢ) with log λᵢ = a + b tᵢ.
The log-likelihood is ℓ(a,b)=Σ[yᵢ(a+b tᵢ)−exp(a+b tᵢ)−log(yᵢ!)].
The score vector is U = Xᵀ(y−μ), where μᵢ=exp(Xᵢβ), β=(a,b). The expected information matrix is I = Xᵀ diag(μ) X. Newton/Fisher scoring updates β_new = β_old + I⁻¹U. At the maximum, U≈0. Standard errors come from sqrt(diag(I⁻¹)).
For the likelihood-ratio (LR) test of trend, compare the trend model with b free to the constant-rate model b=0: D=2[ℓ_trend−ℓ_constant]. With one added parameter, p=P(χ²₁≥D). The Wald statistic is z=b/SE(b).
7.2 Revised Greater Himalaya >10 calculation
Event years: 1992, 2000, 2005, 2010, 2010, 2012, 2017, 2018, 2021, 2021, 2021, 2023, 2026, 2018. N=14.
Useful sufficient sums from the actual annual counts: Σy = 14 and Σ(t y) = 362.
| iter | a | b | score a | score b | Δa | Δb |
| 0 | -1.024504 | 0.000000 | -0.000000 | 96.000000 | -1.028571 | 0.054135 |
| 1 | -2.053076 | 0.054135 | -2.746945 | -63.306459 | -0.259311 | 0.003752 |
| 2 | -2.312387 | 0.057887 | -0.223645 | -4.631747 | -0.036276 | 0.000797 |
| 3 | -2.348663 | 0.058685 | -0.002193 | -0.035481 | -0.000551 | 0.000015 |
| 4 | -2.349214 | 0.058700 | -0.000000 | -0.000004 | -0.000000 | 0.000000 |
| 5 | -2.349214 | 0.058700 | -0.000000 | -0.000000 | -0.000000 | 0.000000 |
Converged coefficients: a=-2.34921398; b=0.05869988 yr⁻¹.
At the solution the fitted moments equal the observed moments: Σμ = 14 and Σ(tμ) = 362.
Information matrix at the solution: [[14.0000, 362.0000], [362.0000, 10750.1854]]. Its inverse gives Var(b)=0.00071948, so SE(b)=sqrt(0.00071948)=0.02682306.
Annual multiplicative factor = exp(b)=exp(0.05869988)=1.060457; annual increase = 6.046%.
Decadal factor = exp(10b)=exp(0.586999)=1.798582; decadal increase = 79.86%.
Doubling time = ln(2)/b = 0.693147/0.05869988 = 11.81 years.
Trend log-likelihood = -28.81769274. Constant-rate log-likelihood = -31.52111426.
D = 2[(-28.81769274)−(-31.52111426)] = 5.40684304; χ²₁ p = 0.02006.
Wald z = b/SE = 0.05869988/0.02682306 = 2.188; two-sided p = 0.02864.
95% slope CI = b ± 1.96 SE = [0.00613, 0.11127] yr⁻¹.
Interpretation: after adding South Lhonak, the Himalayan >10 trend is stronger than in the previous frozen catalogue. The LR p-value is now ~0.020 and the Wald p-value ~0.029. This is statistical evidence of an increase in the observed catalogue, but it is still not proof of climate causation or immunity from detection/classification bias.
7.3 Rest-of-world >10 calculation
N=25. Σy=25; Σ(t y)=487.
Fit: a=-0.51762203, b=0.00379085 yr⁻¹, SE(b)=0.01778018.
Annual change = 0.380%; decadal change = 3.86%.
LR: ℓtrend=-45.34088397, ℓconstant=-45.36362495, D=0.04548197, p=0.83112. Wald p=0.83117.
Interpretation: essentially no fitted temporal trend in the rest-of-world >10 series.
7.4 Revised worldwide >10 calculation
N=39=14 Himalayan + 25 rest-of-world. Σ(t y)=849.
Fit: a=-0.45135232, b=0.02213258 yr⁻¹, SE(b)=0.01449252.
Annual change=2.238%; decadal change=24.77%.
LR: ℓtrend=-54.10791827, ℓconstant=-55.29573426, D=2.37563199, p=0.12324; Wald p=0.12672.
The worldwide >10 trend remains below conventional 5% significance in the main catalogue.
7.5 Direct Himalaya-versus-rest interaction test
Fit both groups simultaneously: log λ = a + b_t t + b_H H + b_I(t×H), with H=0 for Rest of World and H=1 for Greater Himalaya.
Rest-of-world temporal slope = b_t. Himalayan temporal slope = b_t+b_I. The null hypothesis for a different temporal evolution is H₀: b_I=0.
Full-model coefficients: a=-0.51762203, b_t=0.00379085, b_H=-1.83159195, b_I=0.05490903.
Thus rest slope=0.00379085 yr⁻¹ (0.380%/yr) and Himalayan slope=0.05869988 yr⁻¹ (6.046%/yr).
SE(b_I)=0.03218091; Wald z=1.706; Wald p=0.08796.
95% CI for b_I = 0.05490903 ± 1.96×0.03218091 = [-0.00817, 0.11798] yr⁻¹.
Null-model log L=-75.69692322; full-model log L=-74.15857671. D=2[(-74.15857671)−(-75.69692322)]=3.07669302; LR p=0.07942.
Relative trend multiplier per decade = exp(10 b_I)=exp(0.549090)=1.732; 95% CI [0.922, 3.254].
Interpretation: the fitted Himalayan increase is much steeper. After adding South Lhonak, the direct interaction test is now closer to significance than before: LR p≈0.079 and Wald p≈0.088. It is still not <0.05, so the difference between the two regional slopes remains suggestive rather than established.
7.6 Overdispersion / robust uncertainty
Pearson χ² = 106.959; residual df = 78−4 = 74; χ²/df = 1.445. This indicates moderate extra-Poisson variation/clustering.
HC0 sandwich robust SE for b_I = 0.03307388; robust z=1.660; two-sided robust p=0.09688.
This again argues against presenting the interaction as a definitive regional difference.
7.7 Earthquake-removed >10 sensitivity test
Removed: Hattian Bala 2005 from the Himalayan series; Tsaoling 1999, Jiufengershan 1999, McGinnis N 2002, McGinnis S 2002, Punta Cola 2007, and Hapuku 2016 from the rest-of-world series.
Remaining counts: Himalaya N=13; rest N=19; world N=32.
Himalaya slope b=0.06575642: 6.80%/yr, 93.0%/decade; LR p=0.01335, Wald p=0.02166.
Rest slope b=0.01209450: 1.22%/yr, 12.9%/decade; LR p=0.55406.
Worldwide earthquake-removed slope b=0.03214442: 3.27%/yr, 37.9%/decade; LR p=0.04470.
Interaction after earthquake removal: b_I=0.05366192, SE=0.03521625, LR p=0.11810, Wald p=0.12756. Direction remains the same; direct regional difference is not significant.
7.8 Coarse early/late 2×2 check
Predefined midpoint split: early=1988–2007 (20 yr), late=2008–2026 (19 yr). Counts: Himalaya early=3, late=11; rest early=13, late=12.
Himalayan share of all >10 events: early=3/16=18.75%; late=11/23=47.83%.
Late-vs-early odds ratio for an event being Himalayan = (11×13)/(12×3) = 3.972. Fisher exact two-sided p=0.09298.
This coarse check discards timing information and is secondary to the Poisson interaction model.
7.9 Why no strong inferential trend test is reported for >1 Mm³
The >1 catalogue is visibly unstable under additional historical searching. We found omitted older events and, in the GLOF audit, additional modern events. A fitted slope would therefore mix physical change with changing detection effort, satellite coverage, publication, and catalogue construction. The notebook retains >1 histograms/descriptive plots but does not treat an uncorrected Poisson trend on this list as a reliable estimate of physical acceleration.
8. Source-volume logic: examples of what is excluded from the threshold
- Yigong: use ~91 Mm³ source failure, not ~300 Mm³ final entrained/cascade volume.
- South Lhonak: use ~14.7 Mm³ frozen-moraine collapse; do not use ~50 Mm³ lake-water release or downstream sediment volume.
- Langmale: distinguish avalanche material entering the lake from the ~1.3 Mm³ GLOF water release.
- Tam Pokhari: ~19.5±2.2 Mm³ is reconstructed released water; it cannot be used as avalanche volume.
- Gongbatongsha: a small trigger can produce a large downstream flood/debris cascade; downstream magnitude does not make the source failure >1 Mm³.
- Lirung: downstream discharge and debris-flow volumes are not substituted for source slope-failure volume.
9. Detection bias and completeness
The >1 catalogue is demonstrably incomplete historically. During our search, adding old events materially changed early bins. This is exactly the pattern expected from improved detection and documentation. The >10 catalogue is less vulnerable because very large failures are harder to miss, but remote historical events, heterogeneous volume methods, and modern satellite-era reconstruction still matter.
Therefore the statistical statements in this notebook concern the observed catalogue. They are not automatically statements about the true physical occurrence rate.
10. Climate-change interpretation: what the catalogue can and cannot say
The revised process definition deliberately includes frozen moraine/permafrost-rich debris because those materials can fail gravitationally and are physically relevant to warming high-mountain terrain. South Lhonak and Jinwuco show why restricting the population to coherent bedrock or classic rock/ice avalanches would be artificial.
Mechanisms supported by independent studies include glacier retreat and loss of buttressing, permafrost degradation, thaw of ice-cemented sediment, meltwater infiltration, changing precipitation, and altered drainage. These mechanisms make climate influence plausible.
However, this event catalogue alone does not establish climate-change causation. Earthquakes, lithology, slope geometry, precipitation extremes, stochastic clustering, and changing detection/reporting also contribute. The safest wording is that the record is consistent with increasing cryospheric slope instability, with attribution requiring event-specific and process-based evidence.
11. Current revised numerical summary
| Series | Total | 5-year counts |
| Greater Himalaya >1 | 26 | [5, 0, 3, 1, 5, 4, 6, 2] |
| Greater Himalaya >10 | 14 | [1, 0, 1, 1, 3, 1, 5, 2] |
| Rest of world >1 | 41 | [6, 2, 7, 5, 3, 10, 4, 4] |
| Rest of world >10 | 25 | [3, 0, 6, 4, 3, 6, 2, 1] |
| World >10 | 39 | [4, 0, 7, 5, 6, 7, 7, 3] |
Main Himalayan >10 Poisson trend: 6.05%/yr, LR p=0.020.
Rest-of-world >10 trend: 0.38%/yr, LR p=0.831.
Direct Himalaya-vs-rest interaction: LR p=0.079; Wald p=0.088; robust p=0.097.
Thus the revised catalogue strengthens the evidence for an increase within the Himalayan >10 series, while the direct evidence that its slope differs from the rest of the world remains suggestive rather than conventionally significant.
12. Lirung 2026 context retained in the notebook
Event date: 26 Aug 2026. Working interpretation: a very large ice/rock/glacier-slope failure on the north side of the Langtang massif fell roughly a kilometre or more and transformed into a fast debris-flow/flood cascade through Lhende Khola toward Gyirong/Rasuwagadhi. For this catalogue we deliberately separate the initiating slope failure from downstream water/sediment discharge. The 100 Mm³ plotted source value remains provisional.
13. References specifically added by the GLOF audit
- South Lhonak: University of Zurich summary of the international reconstruction (2025), reporting ~14.7 million m³ frozen moraine collapse into South Lhonak Lake and distinguishing it from ~50 million m³ lake-water release.
- Langmale / Upper Barun: Byers et al., “A rockfall-induced glacial lake outburst flood, Upper Barun Valley, Nepal,” Landslides (2019). The reconstruction assumes ~1.1 million m³ avalanche mass entering the lake; the paper also identifies the large Saldim Peak rockfall as the primary trigger.
- Jinwuco: Veh et al., “The 2020 glacial lake outburst flood at Jinwuco, Tibet: causes, impacts, and implications for hazard and risk assessment,” The Cryosphere 15 (2021), reporting ~1.2 million m³ lateral-moraine landslide from DEM differencing.
- Ranzerio: “Triggering factors and flooding processes of glacial lake outburst flood at Ranzerio lake,” npj Natural Hazards (2025), reporting ~3.8×10^6 m³ glacier-tongue collapse as primary trigger.
- Tam Pokhari: detailed photogrammetric reconstruction in Hydrological Processes reports ~19.5±2.2×10^6 m³ water released; this is retained as an example of why GLOF water volume must not be substituted for slope-failure volume.
- Zhong et al. (2024), Geomorphology 449, 109048: HMA rock/ice avalanche inventory and cascading-process framework.
- Zhong et al. (2025), Landslides 22, 989–1001: driving conditions including seismicity, permafrost thaw, lithology, precipitation and high-elevation steep slopes.
14. Unresolved items before any formal publication
- Find defensible initiating-avalanche source volumes for Poiqu No.1 (2002), Tam Pokhari (1998), and Chubung (1991).
- Verify Choya Deurali 2018 and decide whether it belongs in the Greater Himalayan >1 series.
- Resolve Touzhai ~9 versus ~15 Mm³ source-volume discrepancy.
- Make the treatment of correlated earthquake clusters fully consistent; McGinnis N/S are separate whereas Wenchuan is excluded as a swarm.
- Restore and source-check the omitted historical >1 rest-of-world events if the goal becomes a comprehensive global >1 catalogue rather than the compact plotting set.
- Replace Lirung 100 Mm³ provisional plotting value when a defensible source-volume reconstruction becomes available.
- For publication-level inference, test negative-binomial/quasi-Poisson alternatives, possible change points, and explicit detection-effort models; do not overfit because event numbers are small.
- Area/exposure normalization is required before comparing absolute regional rates. The interaction model compares temporal slopes under the assumption that each region’s effective spatial exposure is approximately constant over time.
END OF REVISED WORKING NOTEBOOK